Total Vehicle Sales
According to the National Association of Automobile Manufacturers of South Africa (NAAMSA), total vehicle sales rose by 3.3%% when sales in June 2013 are compared to those recorded in June 2012.
When sales in June 2013 are compared to sales in May 2013, a drop of 1% is evident.
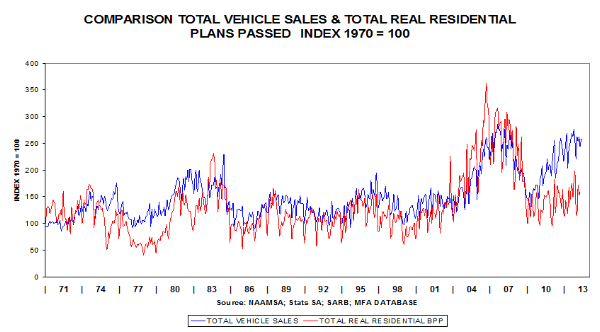
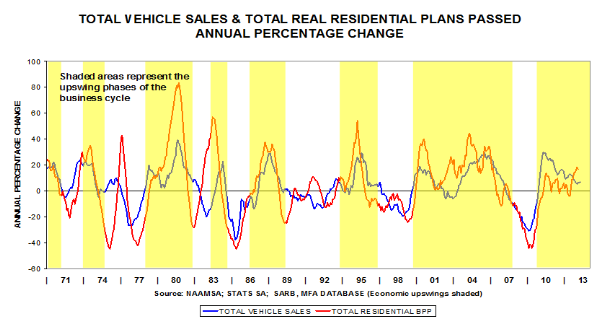
The graphs show the close correspondence in the cyclical movements of our two key indicators (vehicle sales and residential plans passed).
Banking economists tell us that credit advanced for vehicles is readily available because the interest rates charged are higher and the pay-back period is much shorter than for mortgage loans. Also, the amount of an individual loan is less, therefore the risk factor is smaller.
Observe the V-shaped recovery in total vehicle sales and the U-shaped movement in total residential plans passed. It seems as if vehicle sales is topping out.

Though the smoothed annual percentage movement of vehicles is still positive and fairly high at 6.7%, this growth rate is likely to drop further because current levels will be compared to high levels recorded a year ago (known as comparative base effects).


